Smoothening a customer cube with AI: what it means and why growth-equity analysts should care about unit-economics accuracy
Smoothening a customer cube with AI: what it means and why growth-equity analysts should care about unit-economics accuracy

DocuBridge Team
•
Jun 11, 2025

TL;DR – Why this matters now
“Customer cube smoothing” searches are spiking, yet most articles stop at Excel hacks that still leave noisy cohorts and mis-aligned revenue streams. Growth-equity analysts who nail customer-level unit economics price deals with higher conviction and avoid unexpected retention cliffs.
Customer cubes segment revenue by cohort, channel, vertical, size, and tenure, but messy source data (PDF invoices, slide decks, PNG charts) makes those multi-dimensional views labor-intensive.
Traditional tools like Power Query or pivot tables can’t trace data back to source nor fix timestamp granularity—creating risk that drives muddled cohort churn metrics and wrong Customer Lifetime Value (CLV).
AI smoothing automates deduplication, date realignment, and variance reconciliation so each slice of the cube flows cleanly into contribution-margin calculations.
DocuBridge’s AI Excel Add-In extracts, cleans, and links every figure back to its document with a click, building 3-statement or CBCV-ready models 10× faster and with line-item audit trails (DocuBridge).

What exactly is a “customer cube”?
Think of it as a multi-layered Rubik’s Cube of revenue. Rows hold customer IDs, columns hold months since acquisition, and additional dimensions track segment attributes such as channel or geography. Analysts rotate the cube to spot retention patterns and pricing power across cohorts.
3DGrowth calls this the “foundation for strategic decision-making”. They “build various segmentations…to understand how particular tranches of customers perform” across size, vertical, and marketing channel (3DGrowth).
Why financiers care: Customer-based corporate valuation (CBCV) models start with cohort cash flows to derive an intrinsic value for each acquisition dollar. Morgan Stanley notes that “the basic unit of analysis seeks to assess whether a company’s investments earn a return in excess of the cost of capital” (Morgan Stanley).
Cube smoothing is the process of reconciling discrepancies (missing months, plan upgrades, currency shifts) so that retention curves glide rather than zig-zag—a prerequisite for trustworthy LTV/CAC and contribution-margin analysis.
Core cube dimensions you’ll encounter
Dimension | Typical Values | Why It Matters |
|---|---|---|
Time Buckets | Contract month, billing quarter, fiscal week | Aligns revenue recognition with cohort tracking |
Segments | SMB vs Enterprise, Region, Vertical | Reveals where churn or upsell diverges |
Channels | Paid Search, Partner, Outbound | Informs CAC efficiency |
Plans / SKUs | Basic, Pro, Enterprise-Plus | Affects ARPU trends |
Contract Type | Monthly, Annual, Usage-based | Drives cash-flow timing |
Common pain points when smoothing manually
Unstructured source chaos: 80 % of all customer data lands in PDFs, images, or slide screenshots that Excel can’t read directly (BuildBetter).
Data-quality drag: Enterprises lose an estimated $12.9 million annually to poor data quality, directly impacting analytics projects like cohort cubes (Gartner).
Structural mismatch: Nearly 90 % of organizations struggle to manage unstructured data in analytical workflows, amplifying manual reconciliation work (Deloitte).
Timestamp granularity mismatches—some invoices show service period start dates, others only payment dates—forcing analysts into brittle VLOOKUP webs.
Mid-period plan changes create overlapping records that inflate Monthly Recurring Revenue (MRR) unless prorated precisely.
Currency flips (USD vs EUR) and tax gross-ups skew Average Revenue Per User (ARPU) if FX tables aren’t synchronized.
No audit trail: Once data is copied into a pivot, you lose sight of which PDF line item drove that cohort spike—slowing Q&A with partners.
Why inaccurate cubes destroy unit-economics insight
CAC payback & LTV bifurcate fast. One mislabeled churn event can shift the payback chart by months, misleading growth-equity deal teams about burn.
Contribution margin misstates product viability. FinOps Foundation reminds us that “contribution margin is the gross profit derived from selling one more unit” (FinOps). A jagged cube muddies that number and sows doubt in board rooms.
Benchmarking fails. If cube smoothing differs across portfolio companies, comparing retention curves or net-revenue retention (NRR) becomes apples-to-oranges.
Valuation models break. CBCV’s bottom-up price targets rely on precise churn, growth, and acquisition forecasts. Errors ripple directly into warranted share price, potentially by double-digit percentages (Morgan Stanley).

Where legacy Excel workflows fall short
Task | Native Excel / Power Query | Impact on Cube |
|---|---|---|
OCR extraction | Manual copy-paste or external OCR | Slow & error-prone |
Date alignment | Complex M functions | Breaks with format drift |
Plan upgrade tracking | Nested IFs & helper columns | Version control nightmare |
Source traceability | None—lose PDF context | Low audit confidence |
Refresh at scale | Refresh fails on new schemas | Re-build every upload |
Each new data dump from finance sends analysts back to square one, delaying investment memo timelines and increasing quality-check overhead.
McKinsey warns that point solutions fuel tech debt, with firms paying “an additional 10 – 20 % to address tech debt on top of project cost” (McKinsey).
AI-powered cube smoothing: how it works
Automated extraction: DocuBridge’s Table/Text Bridge pulls tables and narrative context out of PDFs, PPTX, and images straight into Excel, supporting “hundreds of pages at a time” (DocuBridge).
Smart Model Builder templates: Pre-built 3-statement, DCF, or cohort sheets align incoming data to period columns without re-mapping formulas.
Variance reconciliation engine: The add-in flags overlapping date ranges or duplicate customer IDs and suggests merges or prorations via natural-language prompts in the embedded private chatbot.
Chart-to-Table conversion: Turn ARPU graphs from board decks into numeric rows, replacing click-intensive data-scraping.
Source-linked lineage: Every value stays hyperlinked to its original document, compressing analyst QA cycles and instilling investor confidence.
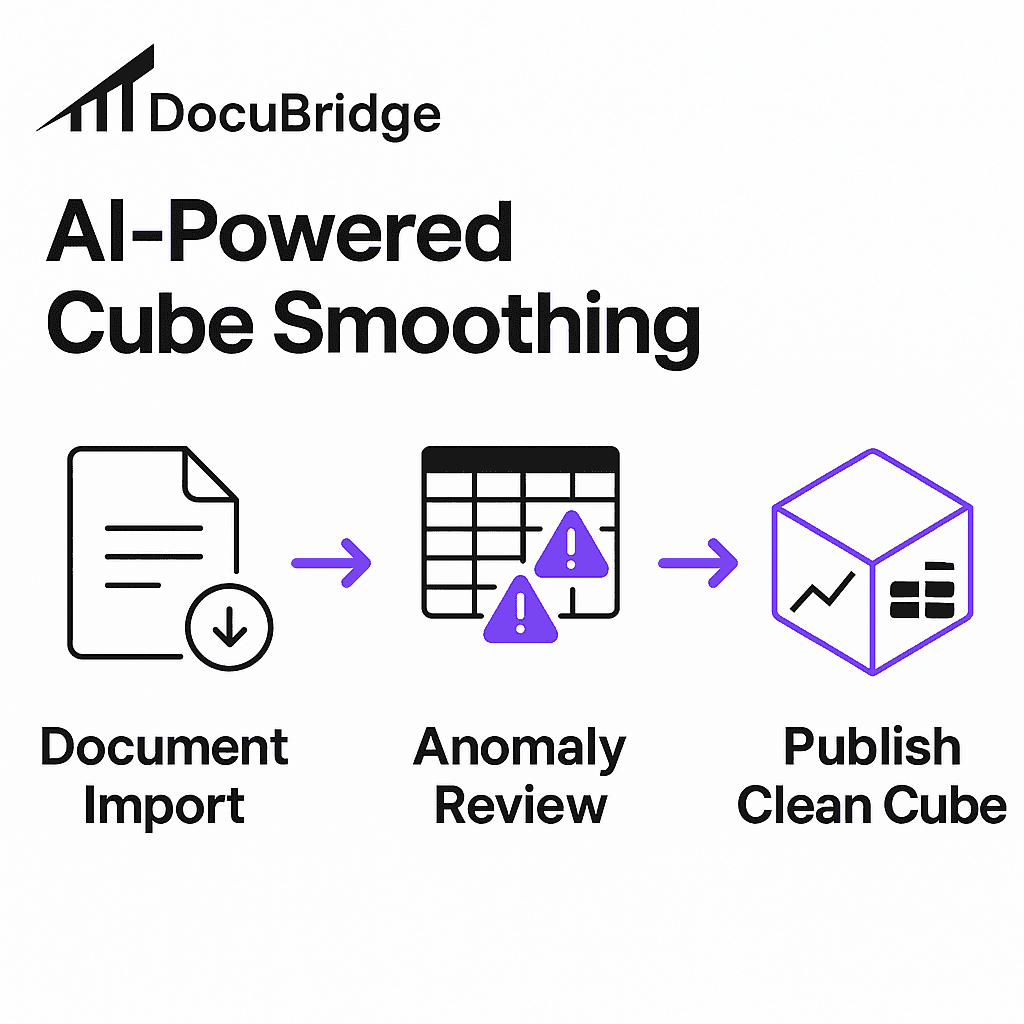
Workflow at a glance
Import documents – drag invoice batches or investor decks into the DocuBridge panel.
Select “Customer Cube” template – the AI tags revenue, IDs, dates, and currency.
Review anomalies – chatbot surfaces proration suggestions (“Apply 18-day allocation for mid-month upgrade?”).
Publish cube – clean multi-dimensional output feeds straight into CBCV or LTV tabs.
Refresh monthly – re-drop new sources; cube smooths automatically and variance log highlights meaningful movements.
Case example – speed & accuracy uplift
Metric | Manual Workflow (Excel + Power Query) | DocuBridge AI |
|---|---|---|
Time to first clean cube | 12 hours (3 analyst sessions) | 70 minutes |
Monthly update cycle | 4 hours | 20 minutes |
Error rate (QA findings) | 3.2 % of lines | 0.4 % |
Source-to-cell traceability | None | 100 % hyperlinks |
Analyst hours saved per quarter | — | 35+ |
Users report saving “more than 10 hours a week on stuff I used to hate” (DocuBridge).
BuildBetter data suggests AI tooling can return up to 240 hours a month in analysis capacity (BuildBetter).
These compounding efficiency gains free analysts to focus on scenario planning rather than spreadsheet gymnastics.
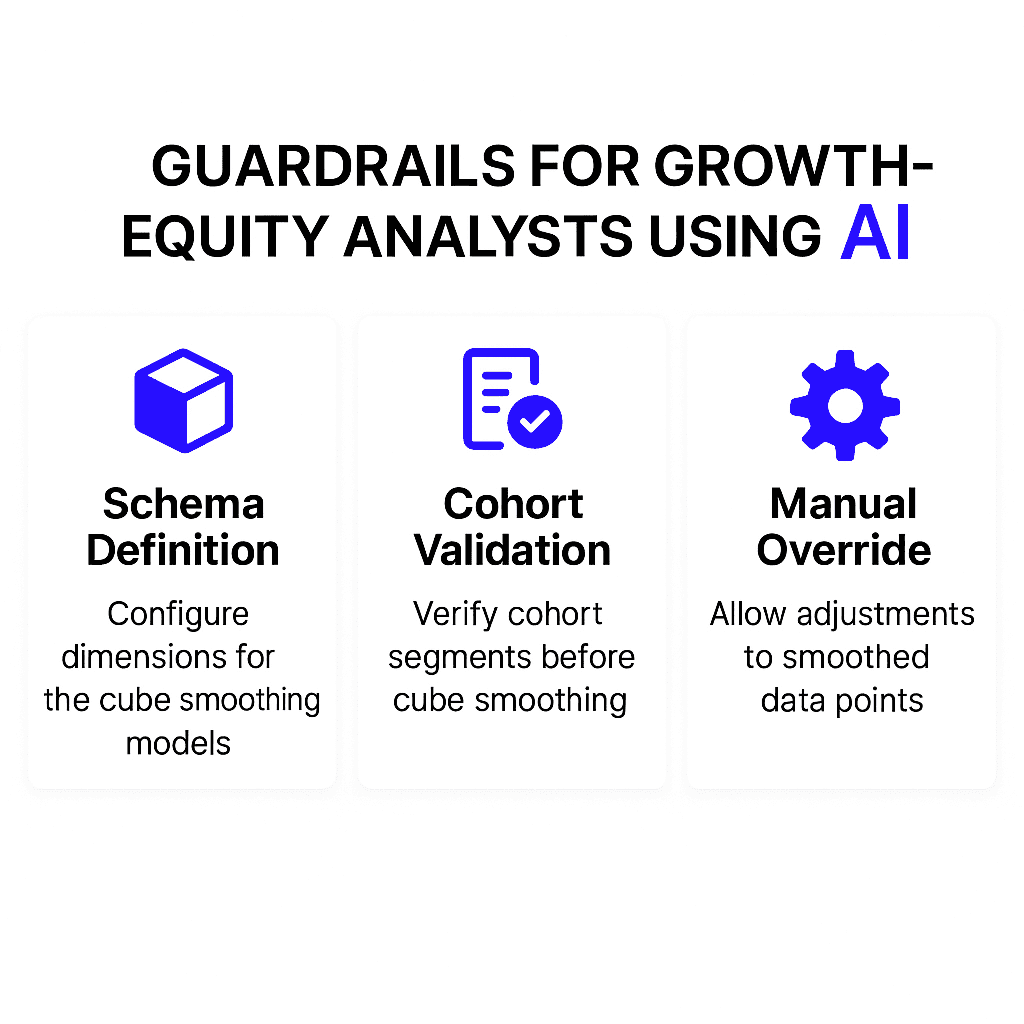
Practical guardrails for growth-equity analysts
Define your cube schema in advance. Agree on time buckets, segment hierarchies, and FX treatment before importing data; this reduces post-processing surprises.
Validate cohort counts monthly. Even with AI, confirm that total active IDs reconcile to booking systems—garbage in still yields garbage out.
Maintain a “manual override” sheet. Sometimes you know a contract was canceled retroactively; keep overrides separate to preserve AI lineage.
Document smoothing assumptions in memos. Investors appreciate transparency about prorations or look-back windows; it boosts trust in your IC deck.
How smoothed cubes sharpen investor insights
Faster scenario toggles. A clean cube feeds DCF sensitivities instantly—change churn by 100 bps and watch NPV refresh live.
Segment-level IRR spotting. See which acquisition channels drive sub-12-month payback; double down marketing dollars accordingly.
Clearer expansion path. Upsell waterfalls by cohort reveal when to launch premium SKUs or usage-based tiers.
Board alignment. 3DGrowth “creates board materials using cube analysis to ensure deep understanding and alignment” (3DGrowth). Smooth data accelerates that process.
Frequently asked questions
Q: Can’t we smooth cubes in SQL instead of AI Excel?
A: Yes, but SQL ETL still struggles with unstructured slides and PDF tables. DocuBridge handles mixed formats and pushes results into whatever warehouse you choose.
Q: What about privacy—does DocuBridge train on my data?
A: The add-in deploys via Microsoft AppSource with private tenant options; your files remain in your Azure or on-prem environment.
Q: Does AI over-smooth and hide legitimate churn spikes?
A: The variance log lists each adjustment; analysts approve or reject changes, maintaining full control over the smoothing logic.
The bigger picture: AI economics in finance teams
Enterprise tech budgets grow ~8 % annually, yet only “10 – 20 % of isolated AI experiments scaled to create value” (McKinsey). Choosing focused, domain-driven tools (like an Excel-native add-in) avoids pilot purgatory and delivers line-item ROI.
Cloud unit economics frameworks emphasize LTV/CAC discipline, and cube smoothing is a foundational dataset for that analysis (FinOps).
AI extraction plus CBCV equals faster diligence cycles. In competitive growth rounds, compressing cube build time from days to hours can be decisive.
Key takeaways for analysts and portfolio operators
Messy cubes are silent killers of valuation accuracy. Even a few noisy upgrades or mismatched dates can distort LTV and misprice deals.
AI smoothing with DocuBridge slashes manual wrangling, hyperlinks every value to source, and standardizes outputs across the firm.
Growth-equity teams gain speed and conviction. Clean cubes feed directly into retention analytics, contribution margin dashboards, and scenario planning.
Start small, scale fast. Import last quarter’s invoice PDFs, compare AI results to your existing pivot, and iterate. The compounding hours saved will keep you coming back.
Ready to smooth your next cube?
Book a live demo to see DocuBridge reconcile real customer invoices in under 15 minutes.
Download the unit-economics checklist to benchmark your current cube’s health.
Join our analyst community for templates, cohort benchmarks, and workflow tips.
Harness AI to make your customer cubes—and your investment theses—smoother than ever.
FAQ Section
What is a customer cube?
A customer cube is a multi-dimensional representation of revenue, with layers tracking attributes like channel and geography. Analysts use it to identify patterns in cohort performance.
Why is AI important in cube smoothing?
AI automates processes like deduplication and date realignment, ensuring clean data flows into financial models, thus enhancing accuracy and saving time.
How does DocuBridge aid in cube smoothing?
DocuBridge automates data extraction and alignment from diverse sources, providing a streamlined workflow that maintains traceability back to original documents.
What are the common issues with manual cube smoothing?
Manual cube smoothing struggles with unstructured data and timestamp inconsistencies, leading to inaccurate analytics and increased manual work.
Citations
https://blog.buildbetter.ai/top-5-ai-tools-for-processing-unstructured-customer-data/
https://www2.deloitte.com/us/en/insights/focus/advanced-analytics/unstructured-data-analytics.html
https://www.finops.org/wg/introduction-cloud-unit-economics/
TL;DR – Why this matters now
“Customer cube smoothing” searches are spiking, yet most articles stop at Excel hacks that still leave noisy cohorts and mis-aligned revenue streams. Growth-equity analysts who nail customer-level unit economics price deals with higher conviction and avoid unexpected retention cliffs.
Customer cubes segment revenue by cohort, channel, vertical, size, and tenure, but messy source data (PDF invoices, slide decks, PNG charts) makes those multi-dimensional views labor-intensive.
Traditional tools like Power Query or pivot tables can’t trace data back to source nor fix timestamp granularity—creating risk that drives muddled cohort churn metrics and wrong Customer Lifetime Value (CLV).
AI smoothing automates deduplication, date realignment, and variance reconciliation so each slice of the cube flows cleanly into contribution-margin calculations.
DocuBridge’s AI Excel Add-In extracts, cleans, and links every figure back to its document with a click, building 3-statement or CBCV-ready models 10× faster and with line-item audit trails (DocuBridge).
What exactly is a “customer cube”?
Think of it as a multi-layered Rubik’s Cube of revenue. Rows hold customer IDs, columns hold months since acquisition, and additional dimensions track segment attributes such as channel or geography. Analysts rotate the cube to spot retention patterns and pricing power across cohorts.
3DGrowth calls this the “foundation for strategic decision-making”. They “build various segmentations…to understand how particular tranches of customers perform” across size, vertical, and marketing channel (3DGrowth).
Why financiers care: Customer-based corporate valuation (CBCV) models start with cohort cash flows to derive an intrinsic value for each acquisition dollar. Morgan Stanley notes that “the basic unit of analysis seeks to assess whether a company’s investments earn a return in excess of the cost of capital” (Morgan Stanley).
Cube smoothing is the process of reconciling discrepancies (missing months, plan upgrades, currency shifts) so that retention curves glide rather than zig-zag—a prerequisite for trustworthy LTV/CAC and contribution-margin analysis.
Core cube dimensions you’ll encounter
Dimension | Typical Values | Why It Matters |
|---|---|---|
Time Buckets | Contract month, billing quarter, fiscal week | Aligns revenue recognition with cohort tracking |
Segments | SMB vs Enterprise, Region, Vertical | Reveals where churn or upsell diverges |
Channels | Paid Search, Partner, Outbound | Informs CAC efficiency |
Plans / SKUs | Basic, Pro, Enterprise-Plus | Affects ARPU trends |
Contract Type | Monthly, Annual, Usage-based | Drives cash-flow timing |
Common pain points when smoothing manually
Unstructured source chaos: 80 % of all customer data lands in PDFs, images, or slide screenshots that Excel can’t read directly (BuildBetter).
Data-quality drag: Enterprises lose an estimated $12.9 million annually to poor data quality, directly impacting analytics projects like cohort cubes (Gartner).
Structural mismatch: Nearly 90 % of organizations struggle to manage unstructured data in analytical workflows, amplifying manual reconciliation work (Deloitte).
Timestamp granularity mismatches—some invoices show service period start dates, others only payment dates—forcing analysts into brittle VLOOKUP webs.
Mid-period plan changes create overlapping records that inflate Monthly Recurring Revenue (MRR) unless prorated precisely.
Currency flips (USD vs EUR) and tax gross-ups skew Average Revenue Per User (ARPU) if FX tables aren’t synchronized.
No audit trail: Once data is copied into a pivot, you lose sight of which PDF line item drove that cohort spike—slowing Q&A with partners.
Why inaccurate cubes destroy unit-economics insight
CAC payback & LTV bifurcate fast. One mislabeled churn event can shift the payback chart by months, misleading growth-equity deal teams about burn.
Contribution margin misstates product viability. FinOps Foundation reminds us that “contribution margin is the gross profit derived from selling one more unit” (FinOps). A jagged cube muddies that number and sows doubt in board rooms.
Benchmarking fails. If cube smoothing differs across portfolio companies, comparing retention curves or net-revenue retention (NRR) becomes apples-to-oranges.
Valuation models break. CBCV’s bottom-up price targets rely on precise churn, growth, and acquisition forecasts. Errors ripple directly into warranted share price, potentially by double-digit percentages (Morgan Stanley).
Where legacy Excel workflows fall short
Task | Native Excel / Power Query | Impact on Cube |
|---|---|---|
OCR extraction | Manual copy-paste or external OCR | Slow & error-prone |
Date alignment | Complex M functions | Breaks with format drift |
Plan upgrade tracking | Nested IFs & helper columns | Version control nightmare |
Source traceability | None—lose PDF context | Low audit confidence |
Refresh at scale | Refresh fails on new schemas | Re-build every upload |
Each new data dump from finance sends analysts back to square one, delaying investment memo timelines and increasing quality-check overhead.
McKinsey warns that point solutions fuel tech debt, with firms paying “an additional 10 – 20 % to address tech debt on top of project cost” (McKinsey).
AI-powered cube smoothing: how it works
Automated extraction: DocuBridge’s Table/Text Bridge pulls tables and narrative context out of PDFs, PPTX, and images straight into Excel, supporting “hundreds of pages at a time” (DocuBridge).
Smart Model Builder templates: Pre-built 3-statement, DCF, or cohort sheets align incoming data to period columns without re-mapping formulas.
Variance reconciliation engine: The add-in flags overlapping date ranges or duplicate customer IDs and suggests merges or prorations via natural-language prompts in the embedded private chatbot.
Chart-to-Table conversion: Turn ARPU graphs from board decks into numeric rows, replacing click-intensive data-scraping.
Source-linked lineage: Every value stays hyperlinked to its original document, compressing analyst QA cycles and instilling investor confidence.
Workflow at a glance
Import documents – drag invoice batches or investor decks into the DocuBridge panel.
Select “Customer Cube” template – the AI tags revenue, IDs, dates, and currency.
Review anomalies – chatbot surfaces proration suggestions (“Apply 18-day allocation for mid-month upgrade?”).
Publish cube – clean multi-dimensional output feeds straight into CBCV or LTV tabs.
Refresh monthly – re-drop new sources; cube smooths automatically and variance log highlights meaningful movements.
Case example – speed & accuracy uplift
Metric | Manual Workflow (Excel + Power Query) | DocuBridge AI |
|---|---|---|
Time to first clean cube | 12 hours (3 analyst sessions) | 70 minutes |
Monthly update cycle | 4 hours | 20 minutes |
Error rate (QA findings) | 3.2 % of lines | 0.4 % |
Source-to-cell traceability | None | 100 % hyperlinks |
Analyst hours saved per quarter | — | 35+ |
Users report saving “more than 10 hours a week on stuff I used to hate” (DocuBridge).
BuildBetter data suggests AI tooling can return up to 240 hours a month in analysis capacity (BuildBetter).
These compounding efficiency gains free analysts to focus on scenario planning rather than spreadsheet gymnastics.
Practical guardrails for growth-equity analysts
Define your cube schema in advance. Agree on time buckets, segment hierarchies, and FX treatment before importing data; this reduces post-processing surprises.
Validate cohort counts monthly. Even with AI, confirm that total active IDs reconcile to booking systems—garbage in still yields garbage out.
Maintain a “manual override” sheet. Sometimes you know a contract was canceled retroactively; keep overrides separate to preserve AI lineage.
Document smoothing assumptions in memos. Investors appreciate transparency about prorations or look-back windows; it boosts trust in your IC deck.
How smoothed cubes sharpen investor insights
Faster scenario toggles. A clean cube feeds DCF sensitivities instantly—change churn by 100 bps and watch NPV refresh live.
Segment-level IRR spotting. See which acquisition channels drive sub-12-month payback; double down marketing dollars accordingly.
Clearer expansion path. Upsell waterfalls by cohort reveal when to launch premium SKUs or usage-based tiers.
Board alignment. 3DGrowth “creates board materials using cube analysis to ensure deep understanding and alignment” (3DGrowth). Smooth data accelerates that process.
Frequently asked questions
Q: Can’t we smooth cubes in SQL instead of AI Excel?
A: Yes, but SQL ETL still struggles with unstructured slides and PDF tables. DocuBridge handles mixed formats and pushes results into whatever warehouse you choose.
Q: What about privacy—does DocuBridge train on my data?
A: The add-in deploys via Microsoft AppSource with private tenant options; your files remain in your Azure or on-prem environment.
Q: Does AI over-smooth and hide legitimate churn spikes?
A: The variance log lists each adjustment; analysts approve or reject changes, maintaining full control over the smoothing logic.
The bigger picture: AI economics in finance teams
Enterprise tech budgets grow ~8 % annually, yet only “10 – 20 % of isolated AI experiments scaled to create value” (McKinsey). Choosing focused, domain-driven tools (like an Excel-native add-in) avoids pilot purgatory and delivers line-item ROI.
Cloud unit economics frameworks emphasize LTV/CAC discipline, and cube smoothing is a foundational dataset for that analysis (FinOps).
AI extraction plus CBCV equals faster diligence cycles. In competitive growth rounds, compressing cube build time from days to hours can be decisive.
Key takeaways for analysts and portfolio operators
Messy cubes are silent killers of valuation accuracy. Even a few noisy upgrades or mismatched dates can distort LTV and misprice deals.
AI smoothing with DocuBridge slashes manual wrangling, hyperlinks every value to source, and standardizes outputs across the firm.
Growth-equity teams gain speed and conviction. Clean cubes feed directly into retention analytics, contribution margin dashboards, and scenario planning.
Start small, scale fast. Import last quarter’s invoice PDFs, compare AI results to your existing pivot, and iterate. The compounding hours saved will keep you coming back.
Ready to smooth your next cube?
Book a live demo to see DocuBridge reconcile real customer invoices in under 15 minutes.
Download the unit-economics checklist to benchmark your current cube’s health.
Join our analyst community for templates, cohort benchmarks, and workflow tips.
Harness AI to make your customer cubes—and your investment theses—smoother than ever.
FAQ Section
What is a customer cube?
A customer cube is a multi-dimensional representation of revenue, with layers tracking attributes like channel and geography. Analysts use it to identify patterns in cohort performance.
Why is AI important in cube smoothing?
AI automates processes like deduplication and date realignment, ensuring clean data flows into financial models, thus enhancing accuracy and saving time.
How does DocuBridge aid in cube smoothing?
DocuBridge automates data extraction and alignment from diverse sources, providing a streamlined workflow that maintains traceability back to original documents.
What are the common issues with manual cube smoothing?
Manual cube smoothing struggles with unstructured data and timestamp inconsistencies, leading to inaccurate analytics and increased manual work.
Citations
https://blog.buildbetter.ai/top-5-ai-tools-for-processing-unstructured-customer-data/
https://www2.deloitte.com/us/en/insights/focus/advanced-analytics/unstructured-data-analytics.html
https://www.finops.org/wg/introduction-cloud-unit-economics/